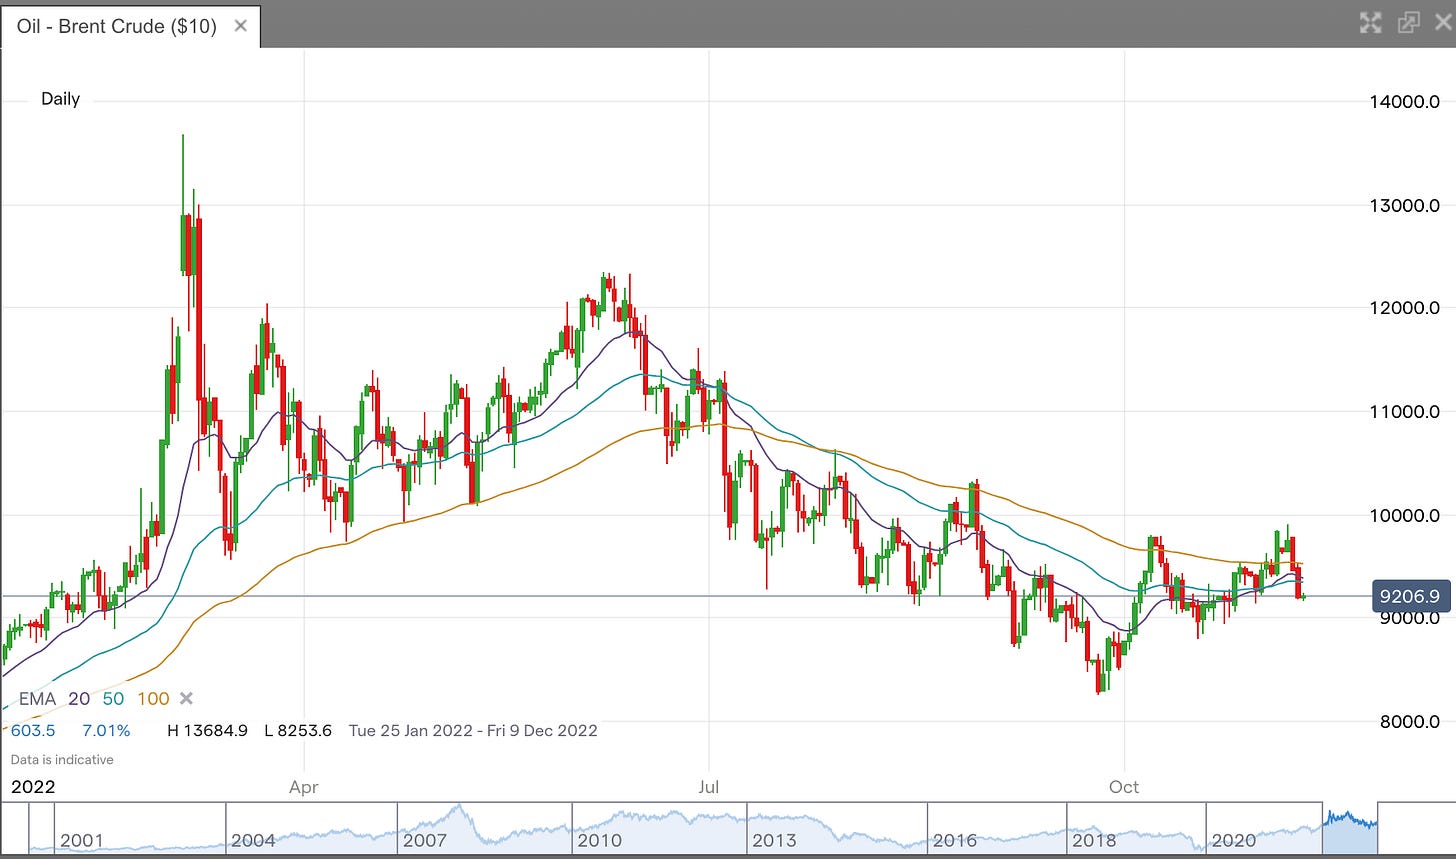
MBCC Trading Highlights 10th November'22 - Why did Oil fall $7/bbl? Does CPI really matter today for the Fed?
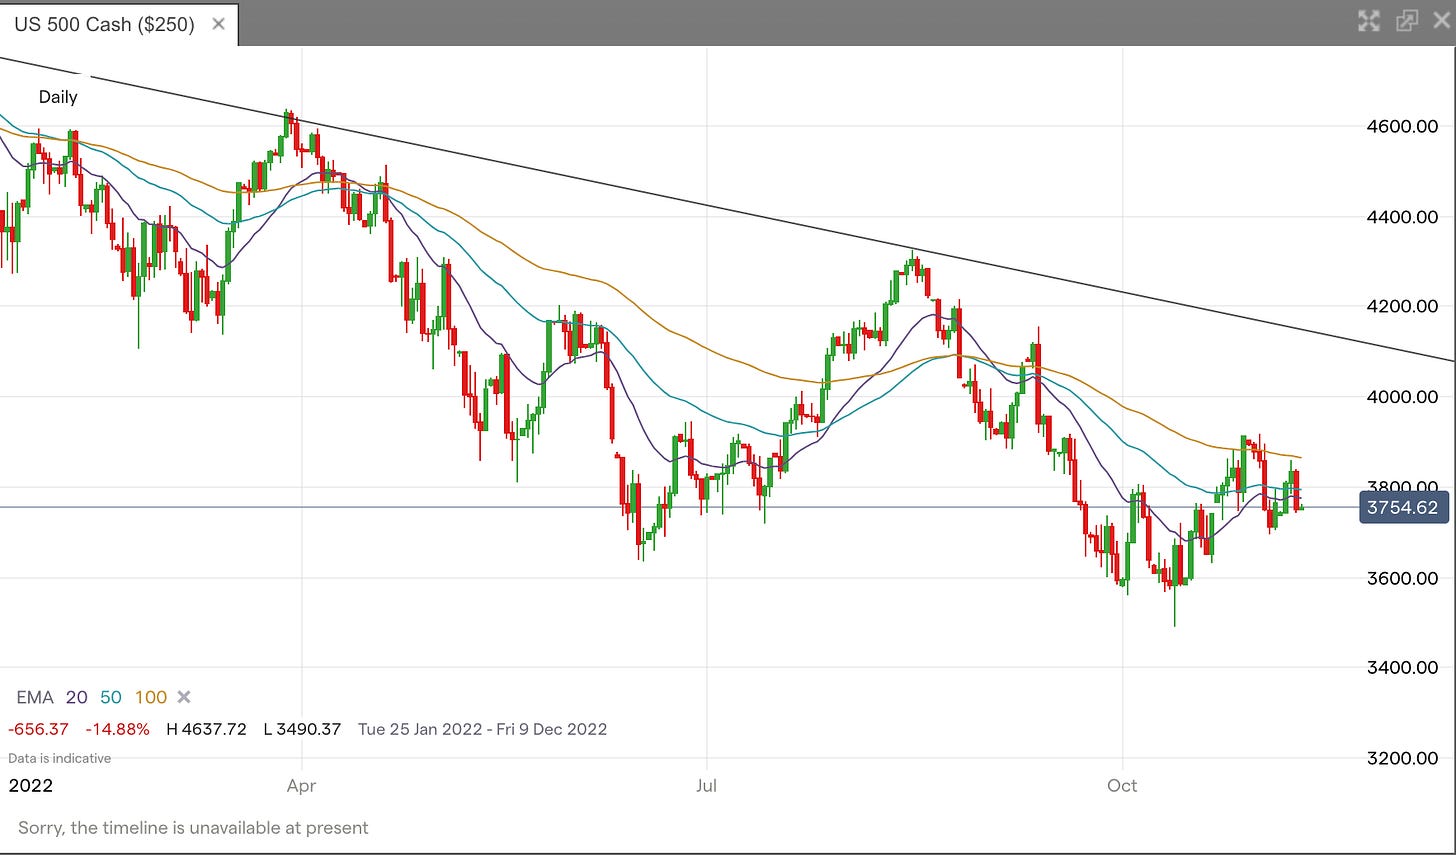
As you can see in the chart above, the S&P 500 has really been stuck in a range of 3700-3900 as such. All the money was hiding in Energy/Oils and out of Tech/long duration assets. As we have been pointing out over the past week/s, the $XLE Energy trade was getting way OVERCOOKED as Equities had broken away from their true fundamental drivers as generalists / analysts blindly believed that Oil could/would be $100/bbl. and higher, so kept discounting the Equities at higher and higher DCF values. Oil was not playing ball, and it was lagging despite these Equities making new highs. And instead of Oil rallying to play catch up, it actually FELL! Why? We discuss this in the section below, for our subscribers, as we pointed out last few weeks and what trading opportunities were present.
Equities are cheap but cheap can get cheaper especially when their driver goes the other way. The past few years has generated a bunch of pure chartists/traders who just look at charts and moving averages to place their bets. Now, we do not discount technical analysis, but it should NEVER lead an investment case, it should only support its entry and exit. Charts do NOT tell you where the market will go, just where it CAN go, when nudged in the underlying true direction. This year has been a great example of how assets u-turned or had false breaks and caught pure chartists out. Oil is a great example as everyone bought the break > $97/bbl. on China reopening etc, when fundamentally the physical market was pointing elsewhere. Of course chart trading has worked over the past decade as markets have been in an uptrend, especially in Equites and Technology etc. so it worked, “buying the dip”. But we are in a very different macro and micro environment, passive investing is not relevant.
Sign up as we break each Commodity and asset class down as we combine our macro cycle forward looking indicators WITH bottoms up physical market movements INCLUDING technical analysis to zero in on mis-priced cross asset opportunities. Commodities cannot be looked at in isolation, stars are aligned when all 3 point the same way.


