Oil chart has broken to the downside, against all the calls out there....

If one were to “just” follow technicals, one would have been long at $98/bbl. after the OPEC+ cuts, but the charts u turned and fell right back down as MBCC said last week. Why? Charts only tell you where the sensitive points of the asset are, they do not tell you where it will go, just where it can go once the true direction is found. Hence if one just trades the charts/technicals, one can get caught out! One needs to look at macro plus the fundamentals with the technical pitfalls.
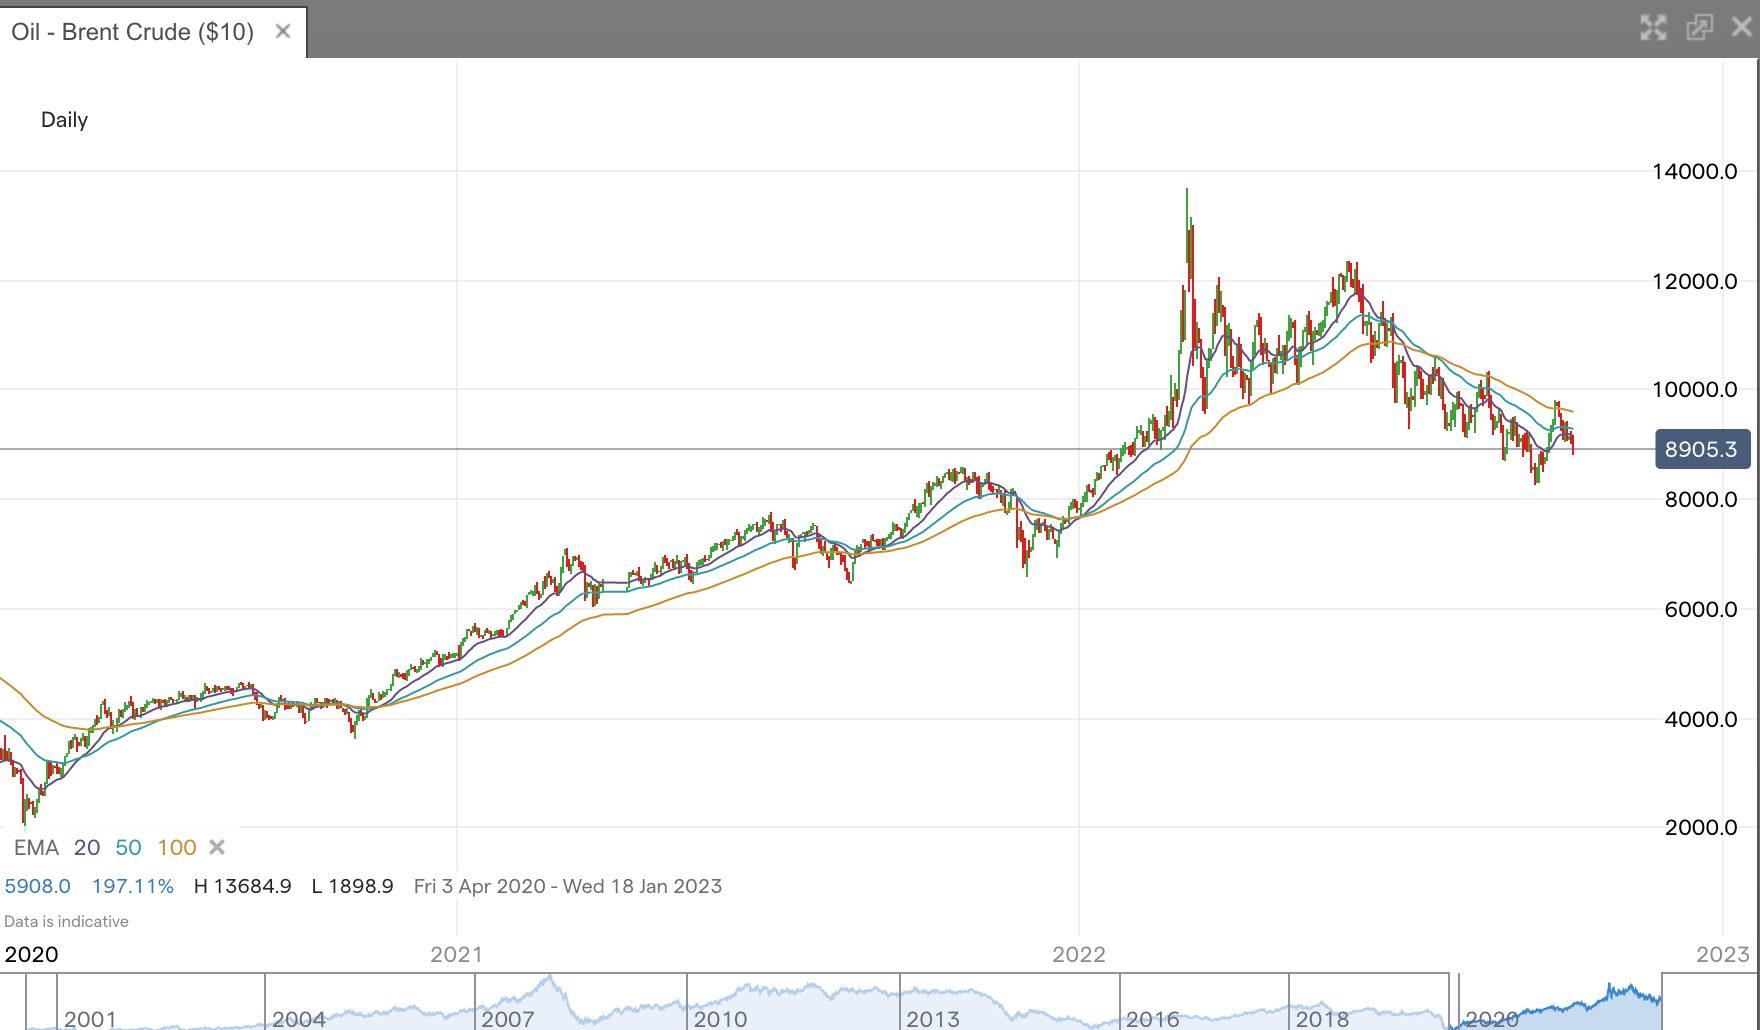
Brent Oil reversed sharply and has now broken < $90/bbl. Brent much to the surprise of all the Bulls that have been claiming “lack of energy” and “inventories running out”. This is not just about what inventories are TODAY, but what they will be TOMORROW. As we have said, once the numbers hit the tape, it will be too late as price would have fallen already. And of course, the big houses then downgrade to match the new “lowered” prices after the fact.
We are now trading < $90/bbl. and this is despite all the talk about energy transition and bad energy policies, true as that may be, but there is a commercial trade and then an academic one. Our macro cross asset models have been pointing down for months now, see all our old posts. It is not an if, but when, a recession hits. We are already in the middle of one and most macro assets are pricing that in. Why should Oil be any different?
Sure Oil Equities are cheap, but cheap can always get cheaper, the question is can you hold onto 30-50%+ losses before being right “eventually”. It is all a timing game.
Sign up to receive our daily updates on what the market can do, not what it has, with a list of our new trading ideas for q4. One stop shop that breaks cross assets down as assets can no longer be looked at in isolation.